> ## Documentation Index
> Fetch the complete documentation index at: https://cloud.laravel.com/docs/llms.txt
> Use this file to discover all available pages before exploring further.
# Requests
> Find your busiest pages, investigate errors, and understand response times.
 ## Introduction
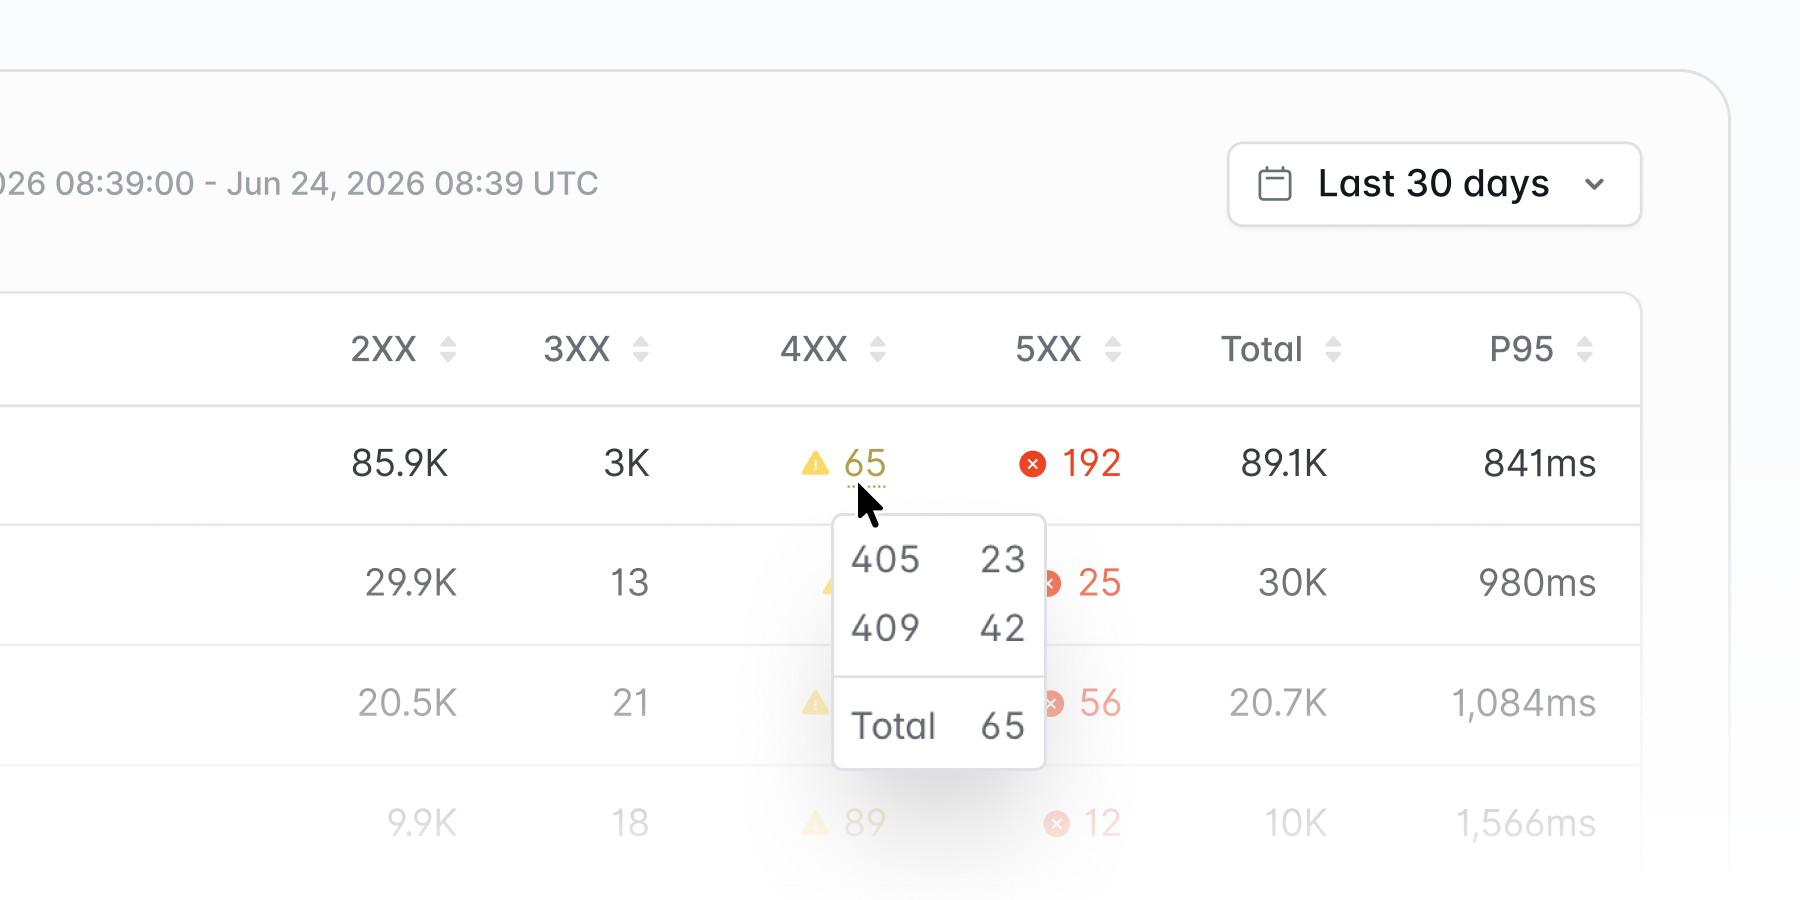
Open the **Requests** tab under **Monitoring** in any environment to see which pages receive traffic, return errors, or respond slowly. Metrics are tracked separately for each environment, including preview environments.
## Choose the traffic to inspect
By default, the page shows the last 24 hours across all of the environment's active domains. Use the domain selector to narrow the results, or choose a time range of 6 hours, 24 hours, 7 days, or 30 days. Available ranges depend on your plan's [metrics retention period](/docs/pricing#plans).
Each row groups requests by URL path. For example:
* `/orders/123` and `/orders/456` appear separately, even if they match the same route.
* `/search?q=cloud` and `/search?q=laravel` contribute to the same `/search` row. Query strings do not create separate rows.
Only requests that return HTML are included. JSON responses, images, scripts, and other non-HTML responses are excluded. Applications that only serve JSON APIs will not see data on this page. Counts represent requests, not visits or unique visitors.
## Find busy or failing pages
Sort by **Total** to find your busiest paths, or by **4XX** or **5XX** to find paths returning errors. Hover over a status count to see the individual response codes and their counts.
| Column | Responses counted |
| --------- | ------------------------------------------------------------------------ |
| **2XX** | Successful responses, such as `200 OK`. |
| **3XX** | Redirects, such as `301 Moved Permanently` or `302 Found`. |
| **4XX** | Client errors, such as `403 Forbidden` or `404 Not Found`. |
| **5XX** | Server errors, such as `500 Internal Server Error` or `502 Bad Gateway`. |
| **Total** | All responses counted across the four status groups. |
These are the status codes returned to the client by the [Cloud edge network](/docs/network#cloud-edge-network). Sorting by a status group selects paths with responses in that group; each row still shows all of its status counts.
The table shows up to 200 paths based on the selected sort column. Counts may be estimated from sampled traffic; hover over the information icon beside **Path** to see the sample percentage when available.
## Understand response times
The **P95** column helps you spot slow responses that an average can hide. A P95 of 500 ms means approximately 95% of measured requests took 500 ms or less, while 5% took longer.
Hover over a P95 value to see the 95th percentile and average for two timings:
| Timing | What it measures |
| ---------- | ----------------------------------------------------------------------------------------------------------------------------------------------------------------------------------------------------------- |
| **Origin** | The time the edge network takes to reach and receive a response from your application, including connection time, so it is more than the time spent running your code. |
| **TTFB** | Time to first byte: the time from when the edge network starts processing a request until it starts sending the response. This does not measure how long the browser takes to download or display the page. |
For a deeper look at individual requests, including the queries, jobs, and exceptions they trigger, connect [Laravel Nightwatch](/docs/environments#nightwatch-integration).
## Introduction
Open the **Requests** tab under **Monitoring** in any environment to see which pages receive traffic, return errors, or respond slowly. Metrics are tracked separately for each environment, including preview environments.
## Choose the traffic to inspect
By default, the page shows the last 24 hours across all of the environment's active domains. Use the domain selector to narrow the results, or choose a time range of 6 hours, 24 hours, 7 days, or 30 days. Available ranges depend on your plan's [metrics retention period](/docs/pricing#plans).
Each row groups requests by URL path. For example:
* `/orders/123` and `/orders/456` appear separately, even if they match the same route.
* `/search?q=cloud` and `/search?q=laravel` contribute to the same `/search` row. Query strings do not create separate rows.
Only requests that return HTML are included. JSON responses, images, scripts, and other non-HTML responses are excluded. Applications that only serve JSON APIs will not see data on this page. Counts represent requests, not visits or unique visitors.
## Find busy or failing pages
Sort by **Total** to find your busiest paths, or by **4XX** or **5XX** to find paths returning errors. Hover over a status count to see the individual response codes and their counts.
| Column | Responses counted |
| --------- | ------------------------------------------------------------------------ |
| **2XX** | Successful responses, such as `200 OK`. |
| **3XX** | Redirects, such as `301 Moved Permanently` or `302 Found`. |
| **4XX** | Client errors, such as `403 Forbidden` or `404 Not Found`. |
| **5XX** | Server errors, such as `500 Internal Server Error` or `502 Bad Gateway`. |
| **Total** | All responses counted across the four status groups. |
These are the status codes returned to the client by the [Cloud edge network](/docs/network#cloud-edge-network). Sorting by a status group selects paths with responses in that group; each row still shows all of its status counts.
The table shows up to 200 paths based on the selected sort column. Counts may be estimated from sampled traffic; hover over the information icon beside **Path** to see the sample percentage when available.
## Understand response times
The **P95** column helps you spot slow responses that an average can hide. A P95 of 500 ms means approximately 95% of measured requests took 500 ms or less, while 5% took longer.
Hover over a P95 value to see the 95th percentile and average for two timings:
| Timing | What it measures |
| ---------- | ----------------------------------------------------------------------------------------------------------------------------------------------------------------------------------------------------------- |
| **Origin** | The time the edge network takes to reach and receive a response from your application, including connection time, so it is more than the time spent running your code. |
| **TTFB** | Time to first byte: the time from when the edge network starts processing a request until it starts sending the response. This does not measure how long the browser takes to download or display the page. |
For a deeper look at individual requests, including the queries, jobs, and exceptions they trigger, connect [Laravel Nightwatch](/docs/environments#nightwatch-integration).